Purchase Data Reporting
For the first time, buyers are engaging with digital products in ways remarkably similar to their behaviors in physical stores. This fusion of digital and physical, also called "phygital," creates a new window into both mindshare and wallet share.With Dopple's Purchase Data integration and out of the box dashboards, you can better understand your buyers, what gives them the confidence to purchase, and how their choices lead to purchase.
SEE ALL DOPPLE ANALYTICS DASHBOARDS →
HOW IT WORKS
Conversion Dashboard

- Conversions dashboard shows add to cart, purchases, and average order value. This gives you a way to compare how much different actions with your product impact choices at each step in the funnel. With this information, you can see opportunities to tune your experience to drive conversion and AOV.
- Custom conversion events can be defined and tracked. For example, track a “find a dealer” or “save my configuration” as a conversion or soft conversion.
Configurations Dashboard
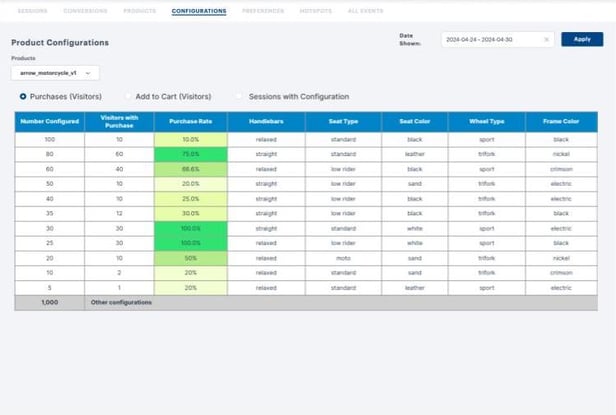
- See which combinations have the highest popularity, number of purchases, and the highest purchase rate.
- Toggle between views by: Purchases, Add to Cart, or Sessions
- Use the insights to display more popular features first, and increase sales
HOW TO SET UP Purchase Data
- Your integration specialist can add an order event to your page to track orders in your data.
- This sends the order ID, order total value, subtotal, and timestamp.
- Conversion and Configuration dashboards in the Dopple platform will appear with your order data.
PURCHASE DATA DEVELOPER DOCUMENTATION →
